Hypothesis
The amount of dead and injured in the United States involving both Assault Firearms and Non-Assault Firearms shows that between the date range [as suggested] of 2004-2016 indicates that more deaths and injuries resulted from the use of non-assault style firearms.
The amount of dead and injured in the United States involving both Assault Firearms and Non-Assault Firearms shows that between the date range [as suggested] of 2004-2016 indicates that more deaths and injuries resulted from the use of non-assault style firearms.
Research data as
provided
Sample #1
Congressional Research Service - July 30, 2015.
Date range of Study: 1999-2013
Sample #1
Congressional Research Service - July 30, 2015.
Date range of Study: 1999-2013
Research study Date
Criteria: 1970-2013
Sample
#2
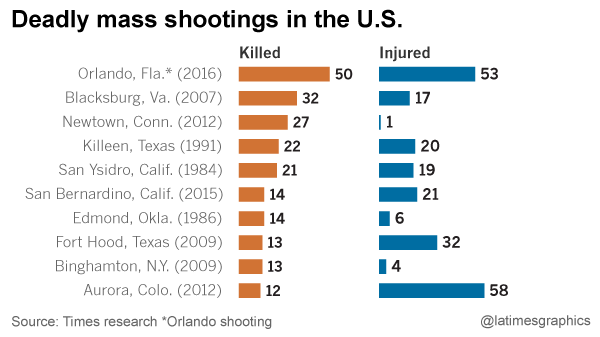
Deadly Mass Shootings Chart
Referenced Date Range: 1984-2016
Deadly Mass Shootings Chart
Referenced Date Range: 1984-2016
Study Research
criteria - UNKNOWN
Sample
#3
Washington Post - June 12, 2016
Date Range of data - 2012 -2016
Data Criteria - Mass Shooting Casualties and Injuries resulting form use of Assault Weapons
Washington Post - June 12, 2016
Date Range of data - 2012 -2016
Data Criteria - Mass Shooting Casualties and Injuries resulting form use of Assault Weapons
Argument
The amount of deaths from assault weapons is statistically higher. Using the provided samples, and extrapolating date ranges of the studies to reflect actual date ranges in which both forms of firearms are used, and the death/injury figures as outlined in the samples.
The amount of deaths from assault weapons is statistically higher. Using the provided samples, and extrapolating date ranges of the studies to reflect actual date ranges in which both forms of firearms are used, and the death/injury figures as outlined in the samples.
For subject #1, we
will use the following two (2) criteria from the study, which is exactly within
the date range requested by the submitter.
Subject 1:
four (4.1) incidents per year during the 2000s (6.4 victims murdered, 4.0 wounded per incident), the figures are as follows;
four (4.1) incidents per year during the 2000s (6.4 victims murdered, 4.0 wounded per incident), the figures are as follows;
Deaths - 4.1*6.4 =
-26.24
Injuries -
4.1*4.0=-16.4
Combined Total 26.24+16.4=42.64
Combined Total 26.24+16.4=42.64
Subject 2:
four (4.5) incidents per year from 2010 through 2013 (7.4 victims murdered, 6.3 wounded per incident), the firgures are as follows;
four (4.5) incidents per year from 2010 through 2013 (7.4 victims murdered, 6.3 wounded per incident), the firgures are as follows;
Deaths - 7.4*4.5 =
33.3
Injuries -
6.3*4.5=28.35
Combined Total -
28.35+33.3=61.65
For Sample #3 we
will use the totals from the reduced date range of 2012-2016 as follows;
Deaths -
14+12+28+49=103
Injuries - 53+20+58+2=133
Injuries - 53+20+58+2=133
Combined Total -
103+133=236
Argument for Sample
#2.
For sample # 2 we will use all of the data form the chart, including three dates 1984 (1), 1986 (2), and 1991 (3), which are noted as being outside the submitter's requested date range of 2004-2016, we are able to provide irrefutable data that supports the argument.
Extrapolating the data from this chart took more time because the chart itself lacked content to easily pull. Using the locations and death/injury counts, I was able to extrapolate the figures based on the hypothesis criteria.
For sample # 2 we will use all of the data form the chart, including three dates 1984 (1), 1986 (2), and 1991 (3), which are noted as being outside the submitter's requested date range of 2004-2016, we are able to provide irrefutable data that supports the argument.
Extrapolating the data from this chart took more time because the chart itself lacked content to easily pull. Using the locations and death/injury counts, I was able to extrapolate the figures based on the hypothesis criteria.
Sample #2
extrapolated AW Weapons as follows;
Deaths -
14+12+28+49=103
Injuries - 53+20+58+2=133
Injuries - 53+20+58+2=133
Combined Total -
103+133=236
Sample # 2 extrapolated Non-AW Weapons as follows;
Sample # 2 extrapolated Non-AW Weapons as follows;
Deaths - 32+13+13=58
Injuries -
17+32+4=53
Combined Total - 111
Note again that
sample #2 includes incidents in chart that took place prior to 2000 (1984 (1),
1986(2), 1991(3)). The data for these incidents is as follows;
Dead
- 57
Injured
- 45
Total
Invalid entries- 102
Research
and Supporting Data
Now we move on the actual data research. For this we will use multiple data sets for comparison. We will use the figures from the samples and the criteria for the research as outlined in the hypothesis and the argument.
Now we move on the actual data research. For this we will use multiple data sets for comparison. We will use the figures from the samples and the criteria for the research as outlined in the hypothesis and the argument.
Sample 1, subject 1:
four (4.1) incidents per year during the 2000s (6.4 victims murdered, 4.0 wounded per incident)
four (4.1) incidents per year during the 2000s (6.4 victims murdered, 4.0 wounded per incident)
Deaths - 4.1*6.4 =
-26.24
Injuries -
4.1*4.0=-16.4
Combined Total 26.24+16.4=42.64
Combined Total 26.24+16.4=42.64
Sample # 3 - Assault
during 2012 - 2016
Deaths -
14+12+28+49=103
Injuries - 53+20+58+2=133
Injuries - 53+20+58+2=133
Combined Total -
103+133=236
Sample 1, subject 1
results shown in a negative figure
Deaths -
26.24-103=(-76.76)
Injuries - 16.4-133=(116.6)
Injuries - 16.4-133=(116.6)
Combined Total -
(-76.6)-(-116.6)=(-193.2)
Sample #1 criteria 1
results
Using the criteria of data set 1 from sample 1 and comparing to sample 3 shows a difference of 76.76 more deaths, and 116.6 more injuries equaling a combined total of 193.2 higher totals of deaths and injuries for assault weapons over non-assault weapons.
Using the criteria of data set 1 from sample 1 and comparing to sample 3 shows a difference of 76.76 more deaths, and 116.6 more injuries equaling a combined total of 193.2 higher totals of deaths and injuries for assault weapons over non-assault weapons.
Sample #1 subject 2:
four (4.1) incidents per year during the 2000s (6.4 victims murdered, 4.0 wounded per incident)
four (4.1) incidents per year during the 2000s (6.4 victims murdered, 4.0 wounded per incident)
Non-Assault style weapons
Deaths - 7.4*4.5 = 33.3
Deaths - 7.4*4.5 = 33.3
Injuries -
6.3*4.5=28.35
Combined Total -
28.35+33.3=61.65
Sample # 3 - Assault during 2012 - 2016
Sample # 3 - Assault during 2012 - 2016
Deaths -
14+12+28+49=103
Injuries - 53+20+58+2=133
Injuries - 53+20+58+2=133
Combined Total -
103+133=236
Sample 1, subject 1
results shown in a negative figure
Deaths - 33.3-103=(-69.7)
Deaths - 33.3-103=(-69.7)
Injuries - 28.5-133
= (104.5)
Total Combined - (-69.7)+(-104.5)=(-174.2)
Sample #1 criteria 1 results
Using the criteria of data set 2 from sample 1 and comparing to sample 3 shows a difference of 69.7 more deaths, and 104.5 more injuries equaling a combined total of 174.2 higher totals of deaths and injuries for assault weapons over non-assault weapons.
Total Combined - (-69.7)+(-104.5)=(-174.2)
Sample #1 criteria 1 results
Using the criteria of data set 2 from sample 1 and comparing to sample 3 shows a difference of 69.7 more deaths, and 104.5 more injuries equaling a combined total of 174.2 higher totals of deaths and injuries for assault weapons over non-assault weapons.
For Sample 2
provided, I will use the figures only from the chart as follows;
Sample #2
extrapolated AW Weapons as follows;
Deaths -
14+12+28+49=103
Injuries - 53+20+58+2=133
Injuries - 53+20+58+2=133
Combined Total -
103+133=236
Sample # 2 extrapolated Non-AW Weapons as follows;
Sample # 2 extrapolated Non-AW Weapons as follows;
Deaths - 32+13+13=58
Injuries -
17+32+4=53
Combined Total - 111
Sample 2 results
shown in a negative figure [Not including figures from 1984(1), 1986(2),
1991(3), which are outside the suggested date range]
Deaths - 58-103=(-45)
Injuries - 53-133=(-80)
Deaths - 58-103=(-45)
Injuries - 53-133=(-80)
Combined Total -
(-45)-(-80)=(-125)
Sample #2
criteriaresults
Using the criteria of Sample 2 shows a difference of 45 more deaths, and 80 more injuries equaling a combined total of 125 higher totals of deaths and injuries for assault weapons over non-assault weapons. Note that sample #2 includes incidents in chart that took place prior to 2000 (1984 (1), 1986(2), 1991(3)) and not used in the above calculations. The data for these incidents is as follows;
Using the criteria of Sample 2 shows a difference of 45 more deaths, and 80 more injuries equaling a combined total of 125 higher totals of deaths and injuries for assault weapons over non-assault weapons. Note that sample #2 includes incidents in chart that took place prior to 2000 (1984 (1), 1986(2), 1991(3)) and not used in the above calculations. The data for these incidents is as follows;
Dead
- 57
Injured
- 45
Total
Invalid entries- 102
Now we will do a calculation comparison using the excluded figures that fall outside the suggested date range.
Non-Assault style
Weapons
Deaths inside the date range
58
Deaths inside the date range
58
Deaths from 1984(1),
1986(2), 1991(3)
57
57
Calculation
58+57= 115
58+57= 115
Assault Weapons
Deaths total
103
Calculation
103-115=(-12)
103-115=(-12)
Injuries using the
same calculations
Non-Assault style
Weapons
injuries inside the date range
53
injuries inside the date range
53
Injuries from
1984(1), 1986(2), 1991(3)
45
45
Calculation
53+45= 98
53+45= 98
Assault Weapons
Deaths total
133
Calculation
98-133=(-35)
98-133=(-35)
Using the criteria of Sample 2 + the data from the excluded date ranges shows a difference of 12 less deaths, and 35 more injuries equaling a combined total of 23 higher totals of deaths and injuries for assault weapons over non-assault weapons. Note that sample #2 includes incidents in chart that took place prior to 2000 (1984 (1), 1986(2), 1991(3)) which are used in the above calculations.
Conclusion
Using
the data provided and the criteria recommended, the hypothesis unsubstantiated
and invalid. The mathematical equations based on all the data provided by the
samples clearly represents irrefutable fact that in the date range of 2012
-2016, the mortality and injury rate incurred by assault weapons is has a
substantial gain over the mortality and injury rate incurred by non-assault
type weapons in the date range of 2000 - 2016.
Even if we add the discounted figures from 1984(1), 1986(2), and 1991(3) the data, used as requested clearly shows that the use of assault weapons is still larger on a combined scale than non-assault weapons.
Even if we add the discounted figures from 1984(1), 1986(2), and 1991(3) the data, used as requested clearly shows that the use of assault weapons is still larger on a combined scale than non-assault weapons.
Written
by: John Stafford (June 17, 2016)